# data
library(rnaturalearth) # Get natural earth data
library(dplyr)         # Data manipulation

# spatial
library(sf)            # Spatial data manipulation
library(rmapshaper)    # Simplify and filter shapes

# plot
library(ggplot2) # Data visualization06 - Creating World Map with World Bank regions (Figure 1)
06_V_world_map_Fig1.qmd
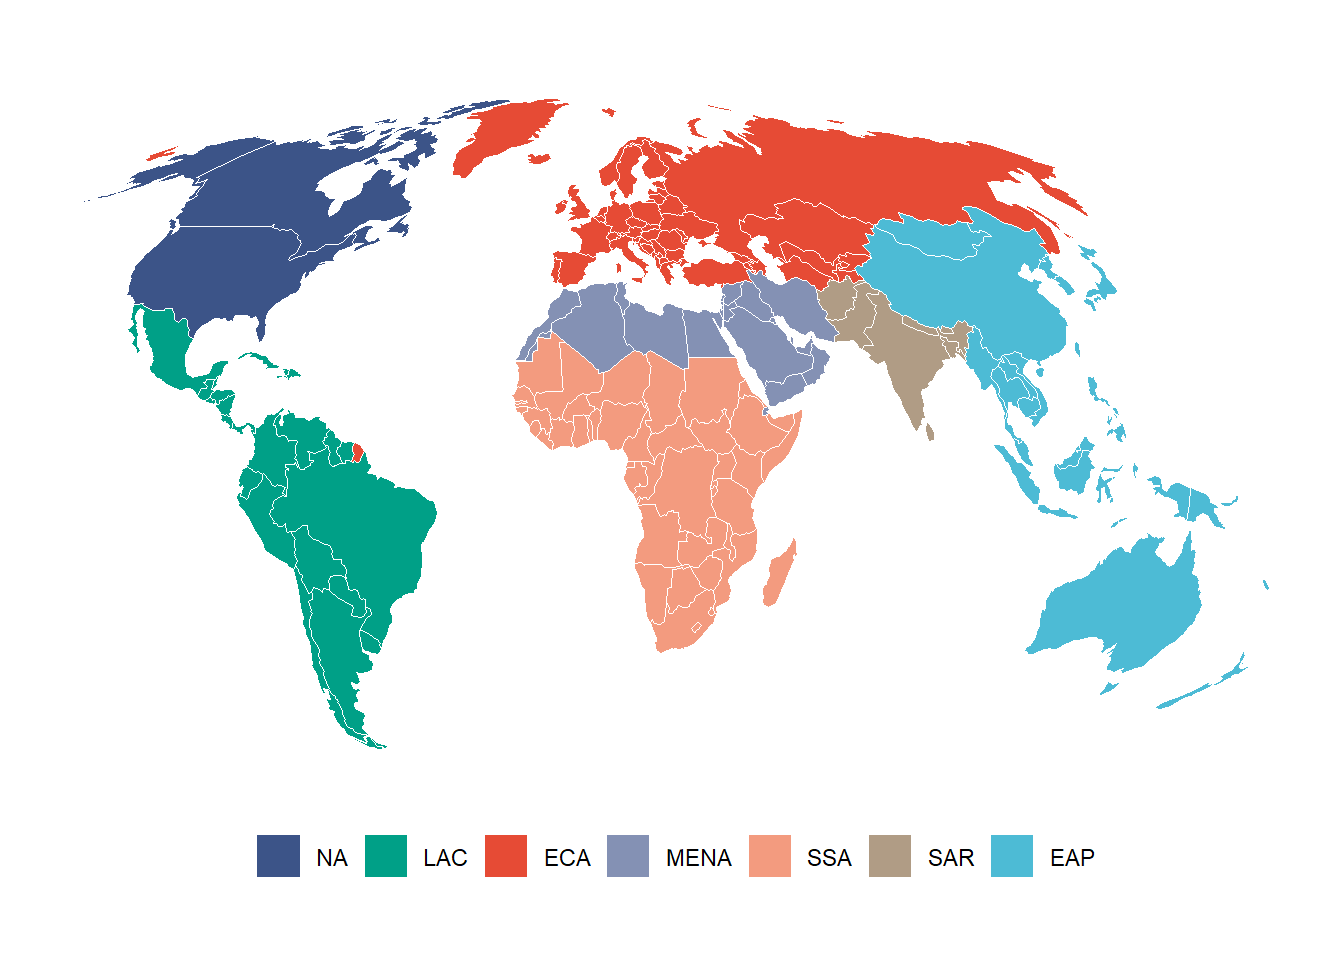
Create world map with WorldBank regions
Note
This map was created to bind it together with the Figure 1 containing circle plots. The full plot was created using inkscape.
Load packages
Get data to create world map
sf::sf_use_s2(FALSE)

world_wb <- rnaturalearth::ne_countries(scale = "small",
                                        returnclass = "sf") |>
  dplyr::filter(region_wb != "Antarctica")|>
  dplyr::group_by(region_wb) |>
  dplyr::summarize(geometry = sf::st_union(geometry)) |>
  rmapshaper::ms_filter_islands(min_area = 20000000000) |>
  rmapshaper::ms_simplify(keep = 0.95)

countries <- rnaturalearth::ne_countries(scale = "small",
                                         returnclass = "sf") |>
  dplyr::filter(region_wb != "Antarctica")|>
  rmapshaper::ms_filter_islands(min_area = 20000000000) |>
  rmapshaper::ms_simplify(keep = 0.95)

world_wb2 <- world_wb |>
    mutate(
      region_wb = dplyr::case_when(
      region_wb == "East Asia & Pacific" ~ "EAP",
      region_wb == "Europe & Central Asia" ~ "ECA",
      region_wb == "Latin America & Caribbean" ~ "LAC",
      region_wb == "Middle East & North Africa" ~ "MENA",
      region_wb == "South Asia" ~ "SAR",
      region_wb == "Sub-Saharan Africa" ~ "SSA",
      region_wb == "North America" ~ "NA"),
      region_wb = factor(region_wb,
                         levels = c(
                           "NA", "LAC", "ECA",
                           "MENA", "SSA", "SAR", "EAP"
                            )))
Plot
world_wb2 |>
  ggplot() +
  geom_sf(aes(fill = region_wb),
          color = NA)+
  geom_sf(data = countries,
  fill = NA,
  color = "white")+
  scale_fill_manual(
    values = c(
      "ECA" = "#f34d4d",
      "EAP" = "#4da8a6",
      "NA" = "#416295",
      "SAR" = "#a6a7a6",
      "LAC" = "#4dae7d",
      "SSA" = "#e0a0a7",
      "MENA" = "#9D7AAB"
    )
  )+
  guides(
    fill = guide_legend(nrow = 1)
  )+
  theme(
    panel.grid = element_blank(),
    plot.background = element_rect(fill = "white",
     color = NA),
    panel.background = element_rect(fill = "white",
    color = NA),
    axis.text = element_blank(),
    axis.ticks = element_blank(),
    legend.position = "bottom",
    legend.title = element_blank()
  )+
  coord_sf(
    crs = "+proj=moll +x_50=0 +y_0=0 +lat_0=0 +lon_0=0"
    )
ggsave(here::here("output", "figures", "worldmap.png"),
       width = 7, height = 5, dpi = 600)